New blog
Ubikcan is dead!
Long live ubikcan (at its new location)

Today is Veterans Day in America and Remembrance Day in Europe. Poppies are used to symbolize the fields of France and the trench warfare of WWI. In Britain a major observance will also take place on Remembrance Sunday (tomorrow).
In the UK most people wear special paper and plastic poppies in the lapel, some with a sprig of leaf on them. Even school children buy them (whether by choice or not), and usually all figures in the public eye (soccer managers, newscasters etc.).
Veterans Day marks the anniversary of the coming into effect of the Armistice during WWI (technically an armistice is a cease-fire so the war did not end until the signing of the peace treaty at the Paris Peace Conference* in June 1919, but most people disregard this and count the war as lasting from 1914-18).
The Armistice came into effect (on purpose) on the eleventh hour, of the eleventh day or the eleventh month, but had actually been agreed earlier that morning around 6am in the Compiègne Forest, just north of Paris. It was signed by General Foch for the Allies and a guy called Matthias Erzberger for the Germans at a special railroad siding in the forest.
Interestingly enough while writing this entry I learned that the armistice for WWII was also signed in the same railroad siding!
*This wikipedia entry is not that great, but maybe will get better over time.

The map above (from the Washington Post by Nate Kelso, NACIS member) shows how Virginians voted in the Senate election on Tuesday.
The CW on Virginia is that it is split, upstate/downstate, but the map, while not denying that, does add in a few extra things worth noting.
1. You can find solid Dem districts downstate and solid GOP districts upstate.
2. According to the statistic provided by the WaPo, just 16% of voters in N. Va. are in exurbs, while 84% are in urban or suburban districts. The exurbs have recently been touted as a rapidly rising and largely Dem group. But what is the split between suburban--exurban?
3. To avoid larger, but less populated precincts from overwhelming the viewer visually, Nate uses a colored circle.
4. Norfolk, site I believe of a large military base, voted for Webb (D).
5. Plenty of places which aren't exactly rural (eg Fauquier County) still voted for Allen. It would be interesting to overlay this on a population density map.
So we used a few numbers from Tradesports before the election to get a feel for how the "market" was assessing outcomes (eg see here, and here).
Tradesports works differently in that it goes up or down according to how many people are buying shares in particular outcomes (such as Dems taking the House or the Senate). It's not magic, because where are people getting information from upon which to make their purchases? Well, polling data of course just like the rest of us.
The difference is that in theory Tradesports reflects what people prefer, as a whole. I'm not sure that that's correct though. When real money is involved, even if you prefer a GOP victory, but think that the Dems will win, which way do you bet? I would think you'd go with your expectation, not your preference.
Do people therefore hold unrealistic expectations? That's really the question for market-based numbers.
Atrios rightly pans Tradesports for not being "magical" and posts this image showing how it blew the Senate call.
I would argue that this shows that the market reflects what people think will happen (ie it's just a reflection of polling) not what they wish or desire to happen. Even Atrios admits he didn't expect the Senate to go Dem.
Therefore it's really just another form of polling.
George Allen is having a press conference in about 3.5 hours--is he anouncing his concession?
AP, NBC and a number of other places have already called both VA and MT races for the Democrats, so this wouldn't necessarily be anything more than recognizing reality. But since that has been in short supply since about 1994, it should be welcomed anyway.
Update: 1:03pm. Hotline has it.

Well, in short, yesterday's predictions did come to pass and I didn't need to cry into my beer. On the contrary, a good time was had by all at the Thinking Man!
There were some remarkable gains in long-shot seats, which the liberal blogosphere is partly credited with (not only fund-raising, but consciousness raising as well, see this post for details).
So, on to the predictions.
I predicted: +25 seats
Actual: +29 (CNN: 10 undecided)
I predicted: +4 Senate seats
Actual: +5/6
The VA is the hold out right now and Jim Webb has declared victory, although Allen has refused to concede (forgetting, perhaps, his calls in 2000 for Gore to concede, stating that to delay is unpartiotic and bad for the country). I'd say Webb has won though. Dems take Senate. Obviously this was my biggest miss, I just didn't see the Dems taking the Senate. And it was sure close.
More races below.
![]()
Off to the appropriately named Thinking Man Tavern (affectionately known as the "Drinking Man") for election results!
They're going to set up a large screen with live election results. So I'll be able to either cry into my beer (literally) or celebrate as the occasion demands!
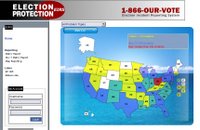
Problems with voting are being reported in realtime on this map (the site is rather slow, I had to reload several times).
Ohio (!) is leading the pack at the moment, as this report from Columbus indicates:
Franklin County phone system returns to serviceThe Columbus DispatchTuesday, November 7, 2006 9:50 AMFranklin County's phone system was returned to service about 90 minutes after it collapsed today under a crush of calls from voters and poll workers.
The volume of calls “overwhelmed the system,” Franklin County Elections Director Matthew Damschroder said.
Phones returned to normal about 9:30 a.m. The system also went down during the May 2 primary, delaying final returns until 2 a.m.
Today is election day: please vote!
Here's a little Youtube video to get things going.

OK, here are the ubikcan predictions for tomorrow's midterm elections. I don't have any special data or insights so of course this is just my opinion based on all the polling, the pundits, and especially the blogs at the local and national levels.
Overall
House to go Democratic, gain of 25 seats (15 needed)
Senate to stay Republican; Democrats gain +4 (6 needed)
PA, RI, OH, and 1 of MO, MT, VA (wimp!). OK, if pushed I predict VA.
No GOP pickups.
Specific races
GA-Gov: Purdue (R) (duh)
GA-04: Hank Johnson (D)
GA-05: John Lewis (D)
GA-08: Jim Marshall (D)
GA-12: John Barrow (D)
CT-Sen: Joe Lieberman (I)
FL-Sen: Bill Nelson (D) (duh, sorry Katherine)
MD-Sen: Ben Cardin (D)
NJ-Sen: Bob Menendez (D)
OH-Sen: Sherrod Brown (D)*
OH-15: Mary Jo Kilroy (D)
OH-18: Zack Space (D)
PA-Sen: Bob Casey (D)*
RI-Sen: Sheldon Whitehouse (D)*
TN-Sen: Bob Corker (R)
VA-Sen: Jim Webb (D)*
WA-Sen: Maria Cantwell (D)
*Pickup
Interestingly, polls can be quite wrong in that there may be 2-3 point difference between the poll and the actual result due to GOTV. Here's an insightful post by Kos for example. He's talking about the recent poll numbers in Virginia:
In 2005, the Democratic ground game swamped the GOP's -- even with Rove's full attention and stewardship. I have no reason to believe that this year should be any different.
Let's go back to the open 2005 governor's race in Virginia:
Rasmussen 11/4/05. Likely voters. MoE 4.5% (10/27 results)
Kaine (D) 49 (46)
Kilgore (R) 46 (44)
Mason-Dixon 11/2-3/05. Likely voters. MoE 4% (10/18-20/05 results)
Kaine (D) 45 (42)
Kilgore (R) 44 (44)
Surprisingly comparable numbers, both heading into the election with the narrowest of 1-point leads. The final results? And remember, the GOP went to the hilt with their 72-hour program.
Kaine (D) 51.72
Kilgore (R) 45.99
So final polls showed 45-44 but actual numbers were 51.72-45.99, and Kos attributes this to GOTV. So races, such as VA which are close, can be determined by the GOTV.
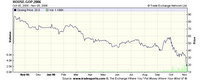
Well the smart money estimate that GOP chances of retaining the House of Reps. tomorrow is:
20.5%
There are also some new betting opportunities, namely on combo Senate and House possible outcomes: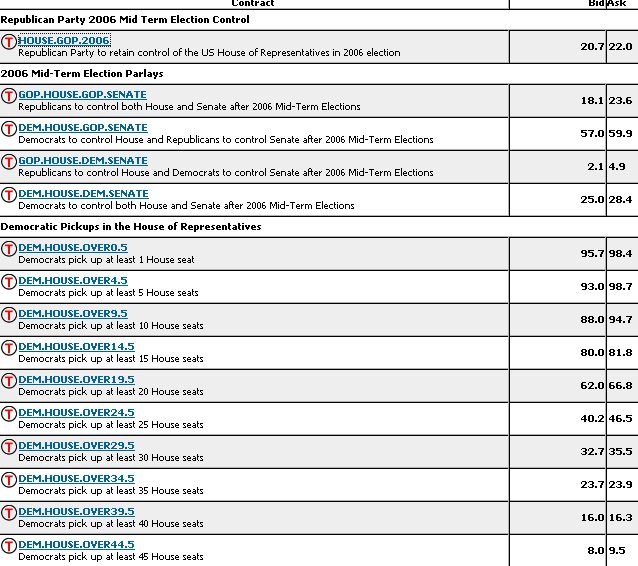
As you can see the biggest bet is that the House will go Dem. but the Senate stay GOP. That is what I'd estimate as well, the day before the polls.
Later today I'll make full predictions, including all the Senate races and selected House races!
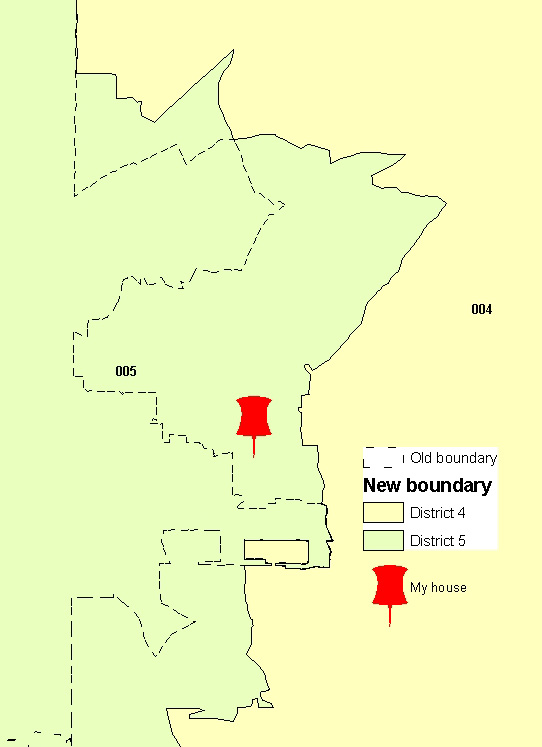
I downloaded the new districts from here and made a quick GIS map of how the district shifted. sorry about the map quality, ArcMap is hard to design in.
The map shows that my house was in district 4 (shown by the dotted line) but is now in district 5 (shown in green).
Wow, exciting.
As anonymous notes in the comments below, the Georgia redistricting is already in effect. The map I presented of GA-08 is therefore the one for the current Congress. If you live in Georgia, who you vote for on Tuesday will be determined by this map:
Colors indicate likely winner (reddish = R, bluish = D).
UGA also has an online interactive redistricting system (plugin required). Here's their version: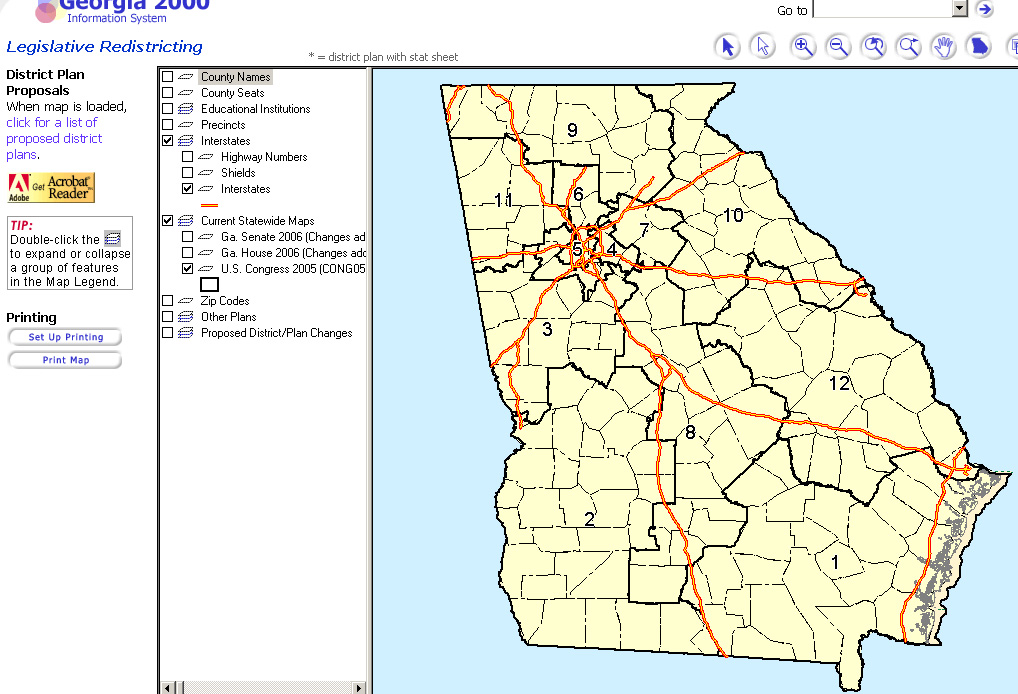
I zoomed in on my road and found that I'm already in GA-05. Their reapportionment center with maps is here.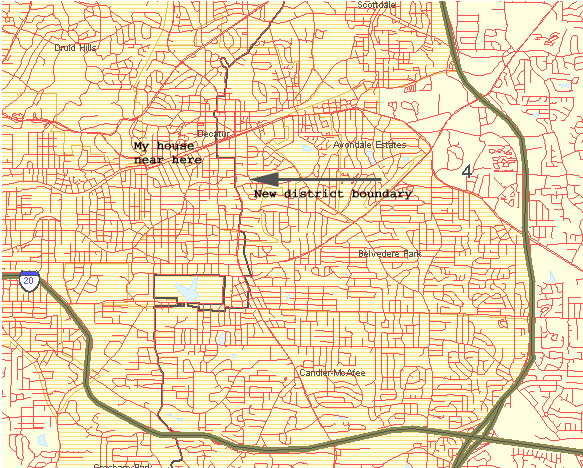
District 4 is to the right, Cynthia McKinney's old district. The straggly line down the middle is the newly adjusted boundary, putting me just over into district 5 on the left.
As they used to say on the Drew Carey show.
Remember when Ohio was the swing state in the last election? And finally went to Bush by119,000 votes? (It wasn't the closest; New Mexico was decided by 5,988 votes.) How the (Republican) Secretary of State oversaw extensive voter disqualification? (In a come-uppance, this man, Ken Blackwell, will probably lose his race for governor, a position held by Repubs. for over 16 years.) There's even a book on the multiple election irregularities that may have tipped it toward Bush.
Now two years on and it's all change in Ohio. Every race shows leads, some of them huge, for Dems. Two-term GOP Senator Mike DeWine will only be the most noticeable casualty.
Even the initiatives favor liberals: a tobacco-sponsored initiative to "wipe out" no-smoking bans is behind, while an American Cancer Society sponsored one on banning smoking in public is ahead.
All this depends on getting out the vote (GOTV). No Dem. GOTV, then maybe Joy Padgett (Bob Ney's hand-picked successor) will prevail (although CQ is now rating this as "leans Democratic," ie toward the nicely named Zack Space).
Ohio District 15: Pryce (R) v. Kilroy (D) shows Kilroy leads 53-41%. Pryce has represented the district for 14 years, but looks like she's on her way out.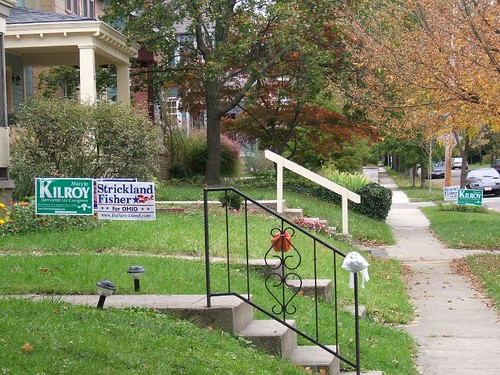
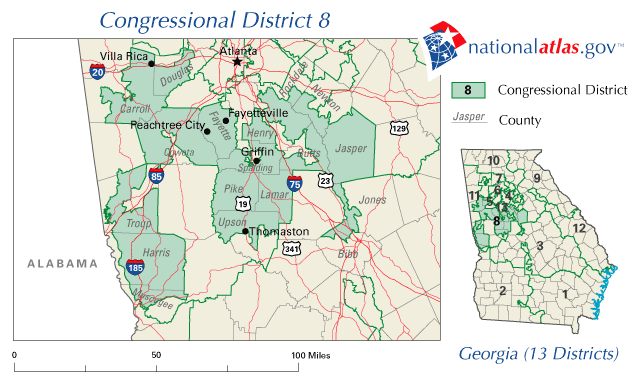
CW is that GA-08 is the GOP best chance of a House pickup. GA-08 was redistricted in mid-decade (it's usual to only redistrict following the decennial census, but Republican controlled states redistricted an extra time in both Georgia and Texas). The shape of the district sure looks funny to me.
A Dem. poll last week showed even this possibility fading. But the Repubs. may not be too worried. The Dem. candidate, Jim Marshall, is extremely conservative, opposes stem-cell research, abortion, gay marriage and gun control, all top level social issues. He better not show up 'round here!
This redistricting by the way means that I wouldn't be in Cynthia McKinney's district, GA-04 (even if she hadn't lost the primary). I would be put into the downtown Atlanta district, GA-05, by just a few streets. A district so Democratic that the Democratic candidate is running unopposed... this is not Georgia here!
Steven Shapin has a long review of a new book on John Snow in the New Yorker. Shapin is a well known respected historian of science, and his review gets most of the story right, including the prominant role of the map in Snow's efforts to convince the authorities that cholera is spread through infected water:As it turned out, the critical evidence came not from this study of commercially piped river water but from a fine-grained map showing the roles of different wells...
Over the last ten years the story of John Snow has been repeatedly told. The story has gone from the straightforward one of the map being the way that Snow realized the Broad Street pump was contaminated (eg., in Tufte's 1983 book) to a realization that Snow used the map to powerfully illustrate his already-developed theory of contagion (then a minority opinion):
What Snow needed was not the biological or chemical identity of the “morbid poison,” or formal proof of causation, but a powerful rhetoric of persuasion. The map Snow produced, in 1854, plotted cholera mortality house by house in the affected area, with bars at each address that showed the number of dead. The closer you lived to the Broad Street pump, the higher the pile of bars. A few streets away, around the pump at the top of Carnaby Street, there were scarcely any bars, and slightly farther, near the Warwick Street pump, there were none at all.Maps like Snow’s allowed the modern city to remake itself and to understand itself in a new way. They collected different sorts of knowledge, represented them vividly on the scale of a tabletop, and made that representation available as a resource for urban reform: a plan and a plan of action.
This latter version, if more complicated, is more interesting. As Shapin points out, science does not proceed neatly from one idea to another but often involves highly contested competing claims, and the ones we now think are right don't always win out straight away.
Read this fascinating description of the life of Hasan Elahi, a conceptual artist and professor at Rutgers University, who has put his total movements online after mistakenly falling afoul of the FBI in 2001.
Elahi, an American, was detained by the FBI at Denver airport. Through a series of mix-ups and over a period time lasting several months, the FBI subjected Elahi to 9 back to back polygraph tests and required him to report in to a FBI monitoring agent.
Elahi decided that if he had to be subject to this kind of monitoring, why not put his whole life online? So he hacked his cell phone to connect to an ankle bracelet to continually record his position on a map. He put up photographs online--hundreds of them, so that he couldn't be accused of digitally altering any of them.
Basically he is responding to the request for surveillance by providing total surveillance: the meals he eats, his bank records, his daily journeys from one place to another. In a way, this both satisfies and defeats the purpose of his monitors--a brilliant act of resistance.

Back in the Spring, the UK paper The Guardian wrote an influential article called "give us back our crown jewels" about access to geographical data. If you as a citizen pay (through taxes) for data collection and mapping why do you then have to buy--often at enormous cost--for that data again? And why is it under copyright so that you will be prosecuted for using it without permission?
The Ordnance Survey, the UK's national mapping body, has just such a cost structure in place in order to recover all its costs. The USGS by contrast recovers just 3% of its costs (approx.). US federal maps are also not copyrighted which means other companies can take them and repackage them--and sell them. It also means individual users don't need to worry about posting USGS maps online in blogs or wherever.
But the Guardian article is part of a growing movement--call it the People's Map project--to provide alternative, copyright free versions of the same data. The paper set up a website that documents some of this activity. For example, some people are using GPS and the web to recreate the UK's system of post codes. Other people are carrying GPS receivers on London Underground trains in order to map the whole system (LU are well known for protecting their famous map and sending cease and desist letters).
In geography we have the academia-based People's Geography project, a great idea that has never really taken off. But this emerging series of People's Map projects, being widely distributed and done by thousands of people has a much better chance of changing the data landscape.
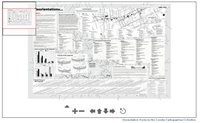
Another example is the Counter Cartographies group. These guys are interested in providing alternative ways of showing landscapes and places. They recently made a "disorientation map" that was given out to incoming freshmen at UNC Chapel Hill. The map challenges students' beliefs and gets them to look at their campus and local environment through a slightly disturbing lens. For example, ways in which the economy is based on SLJs (shitty little jobs) and lack of a living wage. Must have been quite a surprise for these students!
In these last few days before the election on Tuesday, all the talk is of micro-politics. Going door to door to get out the vote. Having micro-maps down to the household level. I was reminded of this again by a story on NPR Morning Edition this morning, which looked at a close race in Iowa.
Micro-politics is all about having fantastically detailed maps of the neighborhood which indicates whether someone is likely to vote, and if so, whether they will vote for your candidate. We're talking block-level politics here, not the usual maps you see online, which only go down to the voting district level.
When I was younger, my father ran for city council a couple of times. We would make this large, extremely detailed map of the voting district and mark off houses that we had canvassed. Likely voters would be colored in two or three colors depending on which party thay had said they would vote for. On election day we could visit these houses and make sure they had voted (offering rides for example to the elderly if necessary).
My father died about nine years ago and I wish I had that map today. As I remember it, it was huge, the size of the whole desktop and colored in by hand in pencils. It had (to me) cryptic annotations and notations. I suppose it had been obtained from the city planning office. Of course, it was all on paper, not computer. There's a certain physicality to maps that can't be replicated on the computer. In fact, their bulkiness and size is part of that, not an inconvenience. So if you can't fold a map ("shut" it), don't worry, you're having a genuine mapping experience!
Well I guess this entry has veered a bit from my original point. Never mind!