6.30.2006

Check out atlas(t)

Just discovered this fantastic new blog, atlas(t), on maps and ways of defining (lots of stuff on naming; several posts on Monmonier's new book). From their opening statement:

We will be explicitly and unapologetically political; we will speak/write from our own cultural context and perspective and not pretend to any impossible journalistic objectivity; we will rant and complain all we like.

We will behave as if this blog is in itself a political act, and furthermore as if the "real estate" or virtual space occupied by this blog is of socio-political and cultural importance ... as if, in fact, our being here mattered.

Wish I'd said that! Mucho cool stuff, check it out.

Study: Cell Phone Users as Bad as Drunk Drivers!

I knew it!

Even using the hands free option, cell phone drivers drive as poorly as those legally over the limit. What's also interesting is that cell phone users deny being affected and think they are driving just fine.

6.25.2006

Anybody read this or know about it?

A new book: The Power of Projections: How Maps Reflect Global Politics and History by Arthur Klinghoffer at Rutgers (Camden) University?

The Amazon page doesn't have much info, but the description looks interesting. Klinghoffr is apparently a prof. of political scince.

6.21.2006

New Method for Dating Maps


Cool. Perhaps this will allow dating of all those controversial maps!

A new and relatively simple method for discovering the date when centuries-old art prints and books were produced has been developed at Penn State. The method could reveal long-sought information about thousands of undated works printed on hand-operated presses prior to the development of modern printing methods in the mid-19th century, including works by Rembrandt and Shakespeare.
Hedges, a world-renowned biologist whose hobby involves Renaissance prints and maps, developed his "print clock" method by first measuring time-related changes in 2,674 Renaissance works. He found that the number of breaks in the lines of images printed from woodblock carvings increased over time, while the image intensity became more pale in copperplate prints...

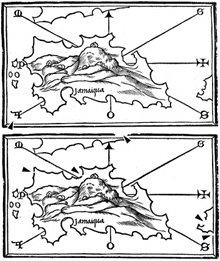
Hedges' woodblock studies involved four editions of Bordone's Isolario, an atlas containing maps of islands. The print date was known for three of the editions, published in 1528, 1534, and 1547, but the age of the undated book has been debated for nearly 200 years, with estimates ranging from 1537 to 1570...

In addition, Hedges used his print-clock technique to calculate the day on which there were no cracks in the wood, revealing the date when the artist finished carving the woodblock. "This estimate of the date the woodblock was carved seemed odd because it was ten years before the date of the first print, but it turned out that the carving date agreed with the historical records, which place the cartography in that earlier decade," Hedges says.

6.04.2006

Red State, Blue State

Digby has an important post about political values and the red state-blue state divide. While at first sight it appears to have nothing to do with maps, it's actually really about the thing that maps are about themselves: namely the political scene itself.

The immediate context is Josh Marshall's post about the New Yorker piece decrying the fact that Democrats are liberals and keep nominating obviously unwinnable candidates:

I think I've read this article one hundred times -- both in its pre-2006 versions and the new-and-improved 2006 editions.

It goes something like this.

President Bush is very unpopular these days and Democrats think they may win back the Congress because of it. But is hating President Bush enough? Or do Democrats need a positive agenda as an alternative to the Republicans? It is thought by some that it might not be enough. Those somes are right to be worried because there aren't as many liberals in the US as conservatives. So trying to frame the election around torture and warrantless wiretaps may not be a good idea. Another reason to be worried is that the white working class, farmers, suburbanites and deeply religious are no longer all reliable Democratic constituencies. But there are some candidates trying to reach out to these ignored constituencies. But will those centrists be forced to cater to the party base and its philosophy of pessimism? It is feared by some that they may be forced to cater.

That's Josh's parody/summary of the New Yorker. Don't nominate a candidate who caters to the progressive base, avoid those values, move to the center, there aren't enough supporters ("liberals") to win.

Both Josh and Digby reject this approach on the following grounds:

1. Digby says that this approach has been tried and it doesn't work: conservatives still hate the southern/centrist/religious Democratic candidates (their names were Jimmy Carter and Bill Clinton). One was impeached and the other is being attacked with censure, 25 years after leaving office.

2. Here's where the geography/maps come in: the point is that there's no such thing as red state/blue state. Maps sometimes make it look like that, but what is really out there is a bunch of people with varying views and we can draw lines around them in any number of ways. Also not to mention that elections take place at all levels of geography (federal, state, local, urban, suburban, exurban, rural...). So the key is not to see a red state and say it's unwinnable, but to see it as diverse and without stereotyped values. In this regard the argument by Ruy Teixeira on whether the suburbas "are" really Republican or a mix of values is very exciting and one of the pieces that got me thinking about mapping and politics. If you could map that diversity more closely and less stereotypically, perhaps at precision mapping levels, you would I think see the diversity. But how to reveal the diversity--that's my interest.

3. Finally, it's still the case that holding to your values is a good thing. Conservative values are on the wrong side of history, especially socially. As for the mood of the country being conservative:
The "mood of the country" is an extremely complex, ephemeral thing with many permutations, not all of them political. But if the the elite press and its GOP string pullers have decided that the political mood is conservative, the last thing I want to do is accomodate it. I want to change it.
Dem's fighting words!
6.01.2006

Art:Maps


Jasper Johns "Map" 1963

The history of the relationship between mapping and art is a long and interesting one. While people like Jasper Johns are well known in this regard (see his painting "Map" above) there are literally hundreds of other artists working in this vein in one way or another.


The journal Cartographic Perspectives has featured a wide variety of map-art on its covers (either maps done artistically or art done cartographically) as seen here in this composite cover. A recent special issue had several articles on map-art.

I'm hoping to cover this topic a lot more on this blog. Suggestions would be welcome--I'm no expert!

Canadian Satellite: New Orleans is Sinking


First day of the new hurricane season today and a new RADARSAT map of New Orleans shows it is sinking faster than previously thought. On average it is sinking at 6mm a year, though in some areas as much as 29mm a year.

Apparently these data are gathered by a Canadian satellite because the US doesn't have an equivalent satellite for research purposes. Nature reports (via New Scientist) that this map may be influential in influencing policy in the area for rebuilding (the Mayor is sworn in today as well).

Of course New Orleans is on a delta and deltas are supposed to acquire silt, but the Mississippi is so channelized that all the deposits are washed out to sea.