Mapping the polls
Can polls predict electoral outcomes? Take a look at these maps: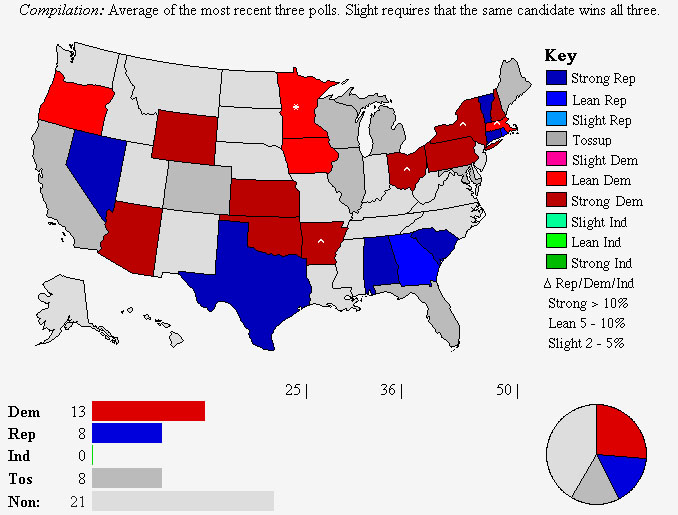
Gubernatorial polls as of May 30, 2006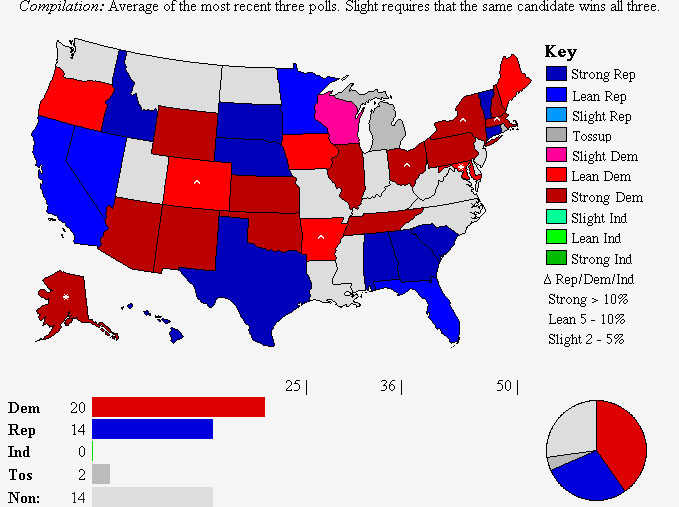
Polls as of Mid-August, 2008
On these maps red = Democratic, blue = Republican. 14 Republican seats are up for election, 13 Democratic and 9 open (1 was Democratic, 8 Republican). The current totals are 22 D, 28 R
Comparing the most recent situation to the one 3 months ago shows a trend toward the Democratic Party--instead of 5 pickups, they show 7 pickups (MD and CO have been added, along with AK, while MN has been taken away. AK may switch around however, depending on who runs).
How accurate will these polls be? A 3-poll moving average is obviously less sensitive to minor fluctuations, and supposedly reflect the deeper underlying feelings in the country. But the supposed "terror bump" that Bush was supposed to pickup after the London terrorist plot last week has not occurred either, so it may be that the electorate is not reacting to news any more, but slowly drifting in its opinions further toward the Democrats.
On the other hand, the NYT has a different scenario. Here's their map of Republican seats (incumbent or open), showing 2 pickups for Dems and 7 toss-ups: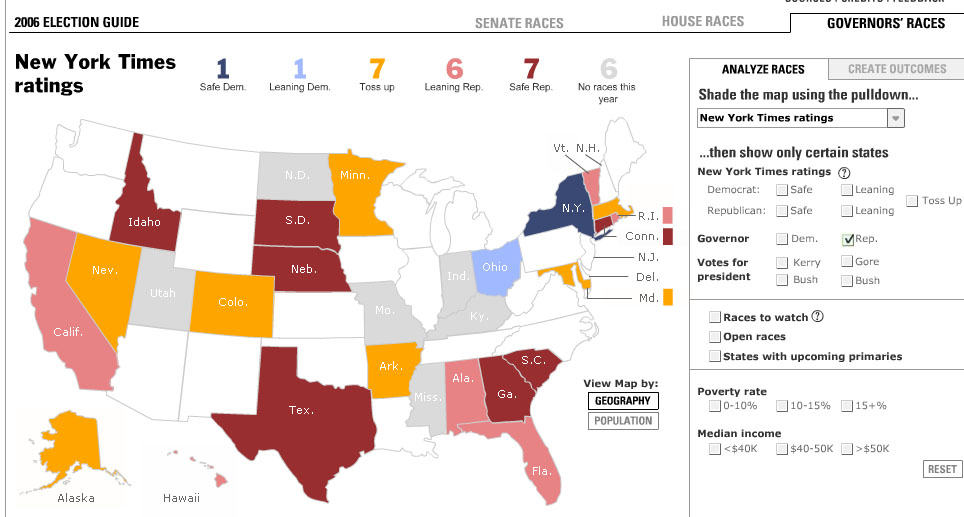 However most of their toss-ups are really D gains or holds (eg., MA, where the latest polls puts Dems ahead by 10 points).
But the NYT site is good to mess around with to show different scenarios.
Eg., show me all the states with a median income over $50k.
However, I wish they would have a different criteria for "toss-up" as I don't think most of them really are.
![]()
No comments:
Post a Comment