Satellite Imagery of Sprawl
Coincidentally to my posts on population densities in the Southeast and in Atlanta, a new study has been announced using satellite imagery to measure urban sprawl: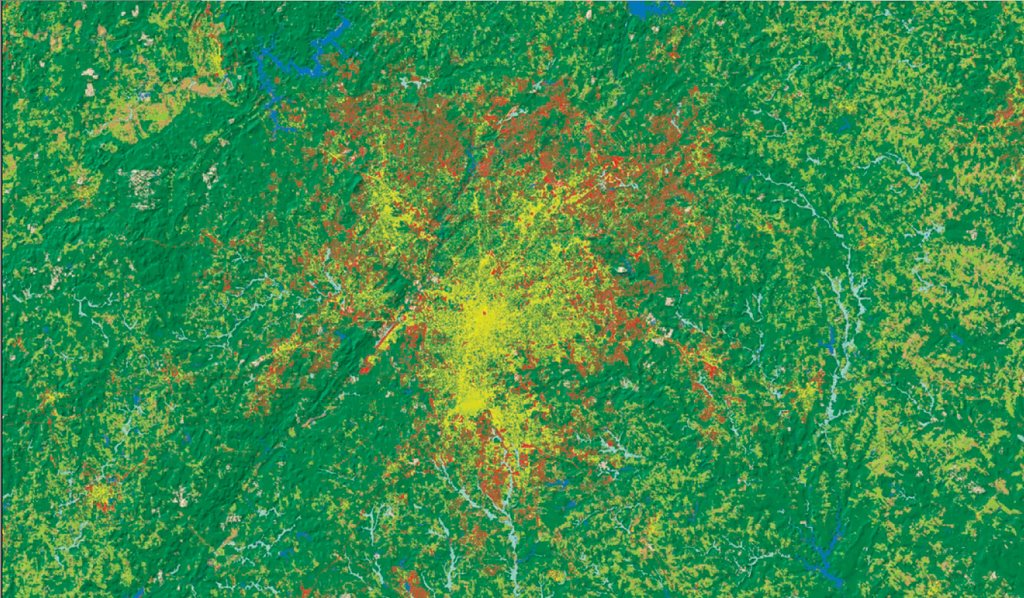
Atlanta urban area, yellow = 1976, red = 1992)
The data are appreciably out of date unfortunately, especially for rapidly growing areas such as Atlanta, but still nevertheless provide an interesting perspective. The authors created a nationwide set of 30 square meter cells from the USGS National Land Cover data (mentioned below).
It should be easy enough to georeference this data even without the original files. There's also an interesting nationwide poster done on the Albers Equal Area projection with a nice shaded relief background.
Here is the actual paper.
(h/t to Cartography).
![]()
1 comment:
Old Data; Older Ideas
A 'sprawl' study published in 2006 based on 1992 remote sensing data? At the very least, the authors could have bothered to analyze the Landsat 7 data available free, online, collected in 1999/2000. And they still would've had those 8.7 billion cells of which they seem very proud.
But that's small beer when the authors tip their hand in the first paragraph by referencing that great touchstone of academic relevance--a public opinion study! Which notes, apparently, that 82% of the public isn't exceedingly troubled by what's implied by the pejorative term "sprawl". But pressing on, we're treated to tables of important data that indicate...people prefer more space to less?
And we're still referencing, early and often, the monocentric city model! Well, in case you didn't catch Peirce Lewis' work in the late 80s/early 90s, which was popularized by Joel Garreau in 'Edge City', who was in turn even more popularized by Tom Wolfe in 'A Man In Full', terms like "monocentric" and "CBD" aren't quite as useful as they used to be. OK, so the authors mentioned above are a little too readable for academic tastes, but hey, occasional slumming has its rewards.
And don't exert yourself researching the relationship of 'sprawl' to phenomena such as the rise of the service sector, the decline of manufacturing, the economics of agriculture, plunging transportation costs for goods, and female participation in the workforce: those data probably aren't available in a pre-packaged remote sensing data set.
Finally, thanking Ed Glaeser is a nice touch--I imagine he was reassured that he won't be outshined by this crew on an academic panel anytime soon.
I hope for their own sakes the authors already have tenure.
BT
Post a Comment