Characterizing Places with GIS
I plan to start a series of posts that attempt to characterize the US southeast and Atlanta in particular using GIS.
There are a number of reasons to do this, partly because I want to see how easy or difficult it is to do with GIS and what insights it affords.
Obviously Census Bureau data will be very important, either from 2000 or updates via ACS. I've never used ACS so that is another reason to become more familiar with it. First up though, two non-census sources for population: Landscan (bottom right) and CIESIN (top left).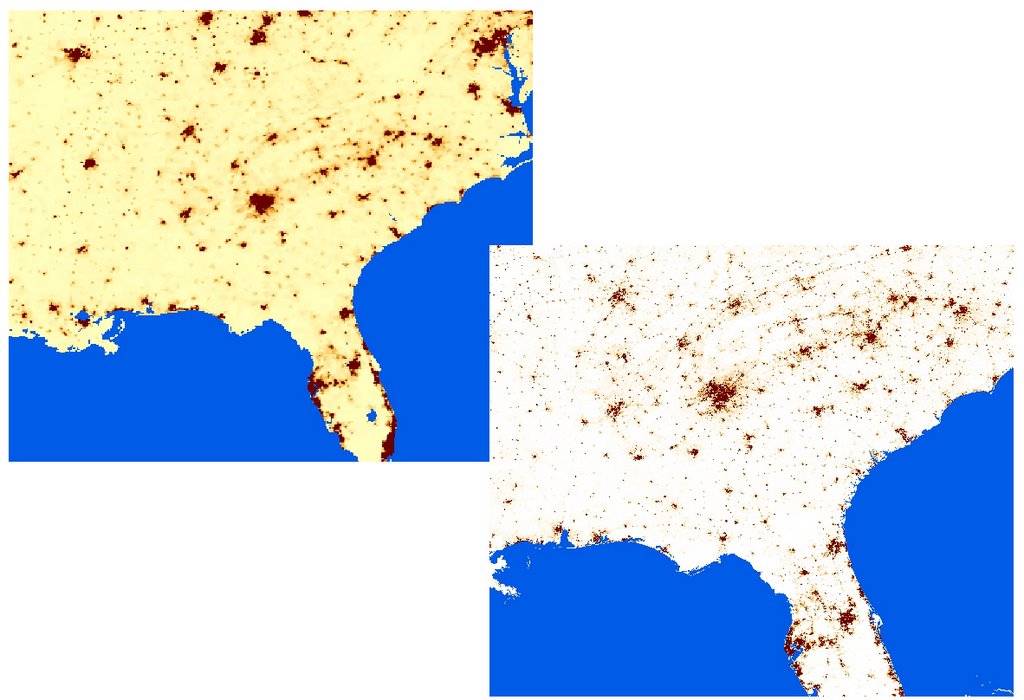
Both use supplemental data (lights at night etc.) to provide estimates of population. CIESIN data are at 2.5' (minutes) resolution.
Here is a close up, both maps on the same scale (1:1,600,000):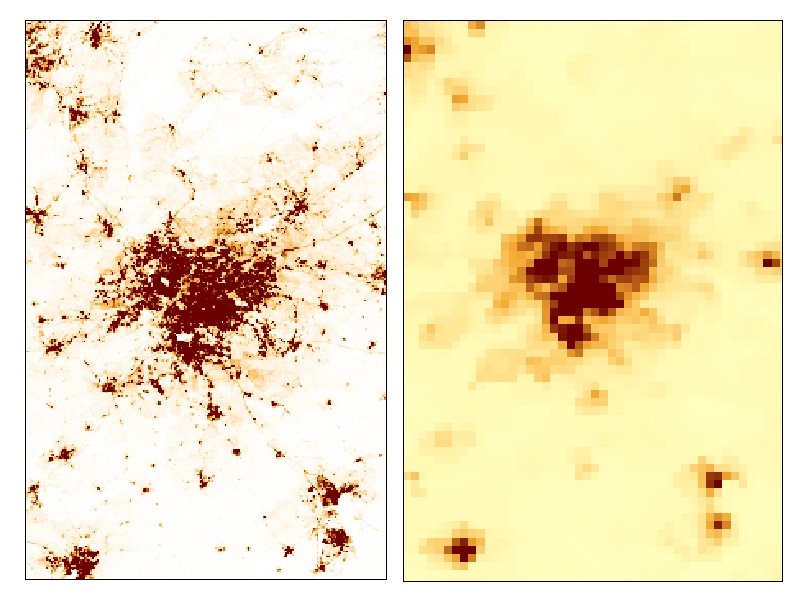
Landscan on left and CIESIN on right. It would appear that Landscan is far superior, but the advantage of CIESIN is that it is downloadable as population density. I don't believe the Landscan is, rather it is population totals per unit area. Since unit area varies with latititude (though perhaps not much in the detailed view) this can throw things off. So, there is a correction factor you have to use, a density grid:
Update: If anyone can tell me how to apply this correcting grid, please let me know.
![]()
No comments:
Post a Comment